NEW CHART (@ 2020-07-29 02:33:31)
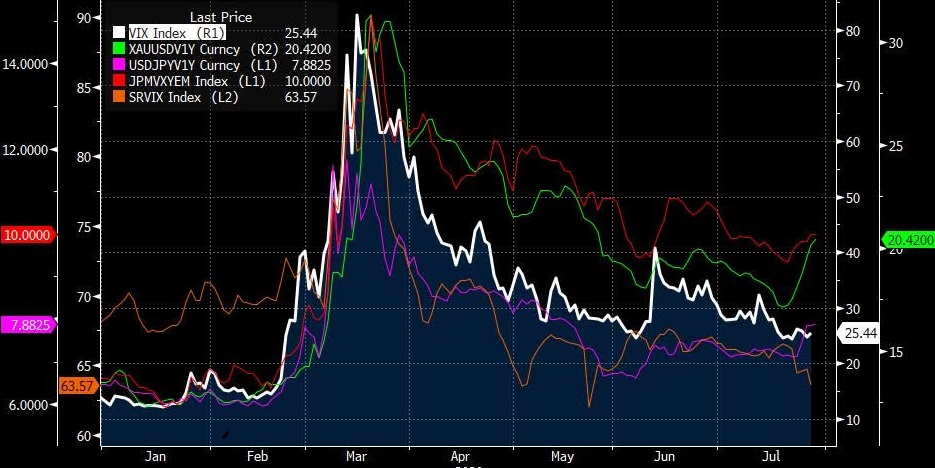
One interesting chart we have been looking at today depicts implied volatility across a few asset classes. This chart shows equity (VIX), gold (XAU), JPY (USDJPY), EM FX (JPMVXYEM) and interest rates (SRVIX). What is apparent here is that volatility on interest rates and stocks have steadily declined, but lately gold, JPY and EM FX are bucking the trend and increasing again. 2020 is truly a US dollar story. -LSS Quant Team