NEW CHART (@ 2020-07-29 16:19:07)
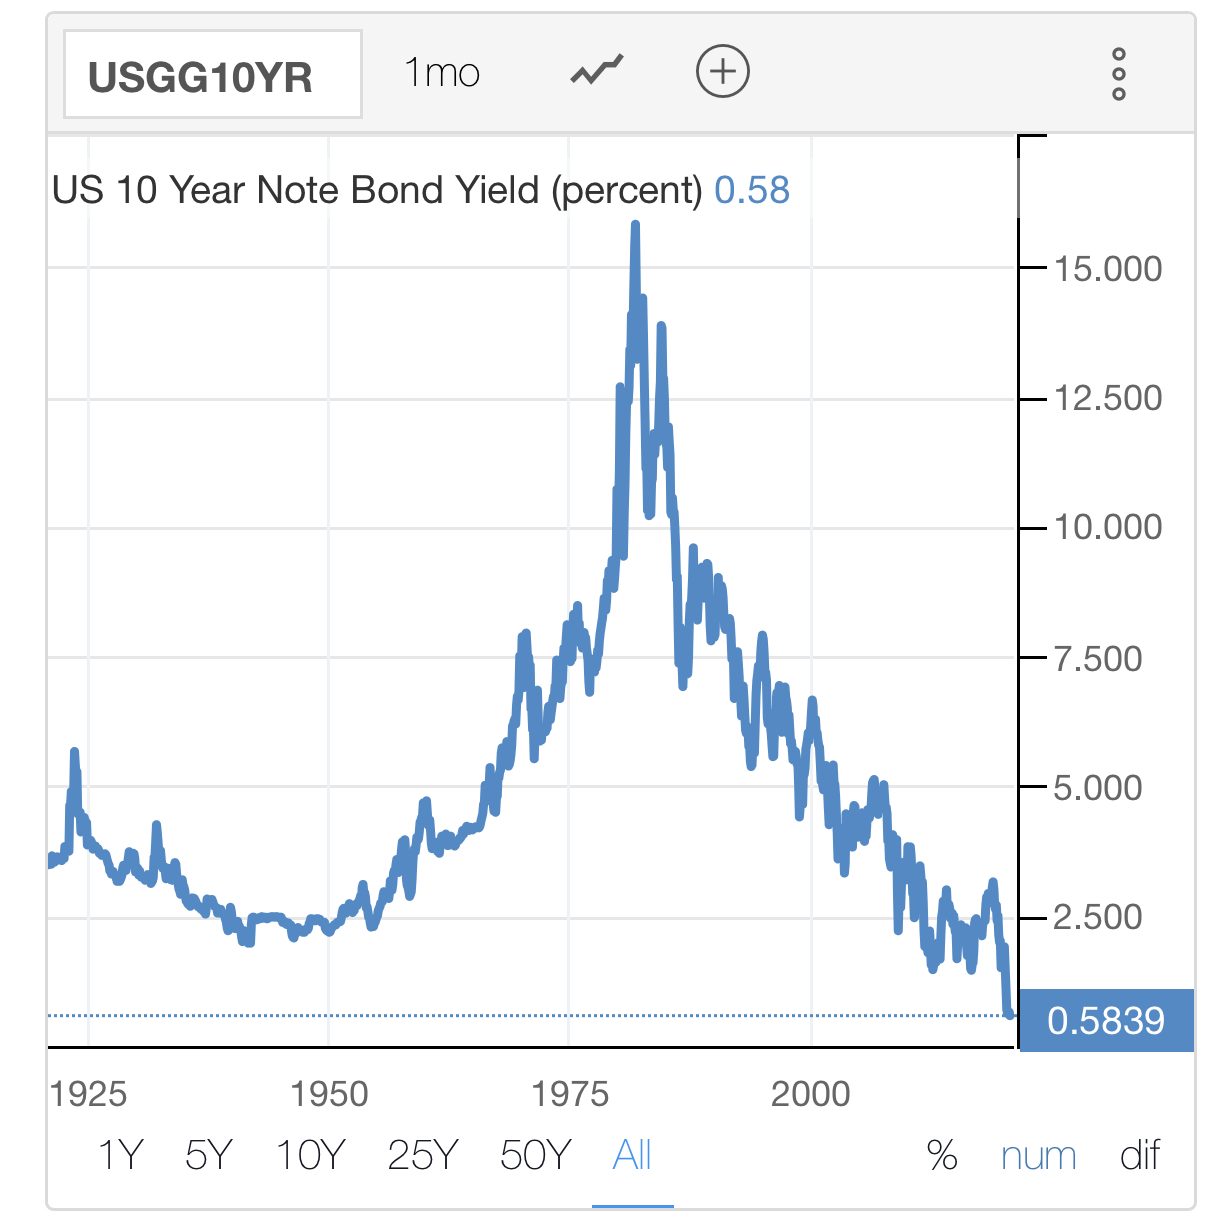
So the Fed decided to leave rates unchanged and keep doing “whatever it takes”. The 10 year US interest rate chart fascinates us because what other asset over a period of 100+ years only really sees 3 different regimes? Down 1920-1940. Up 1950-1980. Down ever since. There does not seem to be an easy way out from this trend and we would be surprised if this figure hits anywhere above 2% again any time soon without serious economic turmoil as a result. -LSS Quant Team