
Posted on 7th Jun 2020 by the LSS team
Traditional portfolio management focuses on a long-term continuum
Traditional portfolio management on the buy-side often still centres around Modern Portfolio Theory, a half a century old theory which describes the idea that the expected return of a portfolio can be maximized for a given level of market risk. In other words, if you are targeting a volatility of 8%, there is an optimal portfolio that provides you with the maximal achievable return for that level of risk. As you scale back your risk appetite, your expected return diminishes and there is an "efficient frontier" of portfolios that are optimal at each level of risk.
Portfolio construction is often done based on historical data for variance, covariance and the expected return of assets. For instance, the correlation between stocks and bonds since 1990 has been -0.23 (evidence suggests that lately these correlations may be rising, which is not surprising as interest rates reach their lower boundaries), while annualized return and volatility on the S&P500 has been 10% and 17%, respectively. These figures may lead to a portfolio weight of for example 60% stocks and 40% bonds as the optimal combination.
Risk management tools do the same
In addition to portfolio construction, risk management through tools like Value at Risk (saying "with X% probability we will not lose more than Y% over Z days/weeks/months") has similar underpinnings. Based on either the historical or simulated return distribution of an asset over a given time frame, we project what the worst-case possible outcomes could be with a degree of confidence.
This is the macro investing philosophy that will underpin the investment suggestions of nearly every wealth manager you will meet at your local financial advisor or banking branch. Their decisions are driven by the belief that your portfolio has a certain risk tolerance and return expectation, and when markets sell off like in 2008 or 2020, you should just ride it out and focus on the longer-term.
Looking at the stock market, traditional wealth management looks at the 2000-2020 period as a continuum and concludes that the -38% return on stocks of 2008 is located on the far left side of the return distribution, while the 2019 return of +30% is on the far right side of the return distribution. The more advanced practitioners know that such an approach is problematic, as markets go through regime shifts. If stocks have a volatility of 40% with an expected return of -10% in one regime, and a volatility of 10% with an expected return of 10% in the other, why do advisors average out these regimes and ask you to ride out long term volatility?
Our investment process focuses on these distinct market regimes
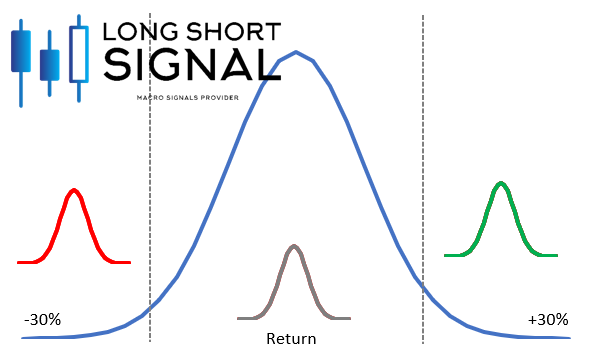 Image: return distributions as part of a continuum (blue line) versus return distributions in regime shifts (red, grey, green lines)
Rather than focusing on the blue return distribution above, we know that markets behave differently when they are in either the far left tail (red distribution), far right tail (green distribution) or in the middle (grey distribution). With the right statistical tools involving some degree of statistical analysis and some degree of machine learning, we can estimate with a certain degree of certainty where in the spectrum of returns you are most likely to be today. If we are in the green or grey portion, we would recommend to invest. If we are in the red portion or seemingly moving towards it, better keep away. LongShortSignal provides you with these signals on a daily basis, allowing you to manage your risks better and to outperform the broader market across stocks, bonds, commodities, currencies and cryptocurrencies alike.
The case of oil
The below chart shows the signals provided by our model for oil - available to our premium subscribers - over the last 1.5 years. We see that from early 2019 till early 2020 we were mostly in a positive or neutral regime. There were times oil increased (going up 20 points at some point in 2019) and times it moved sideways, but generally, it was OK to take exposure to commodities in your portfolio. Note how there were times where oil dropped by 10 points but the signal suggested that we stay invested. Somewhere in early 2020 things changed as oil was hovering around the mid 60s, and the signal told you to at least get out, or maybe even to short. Oil would go on to drop 70%.
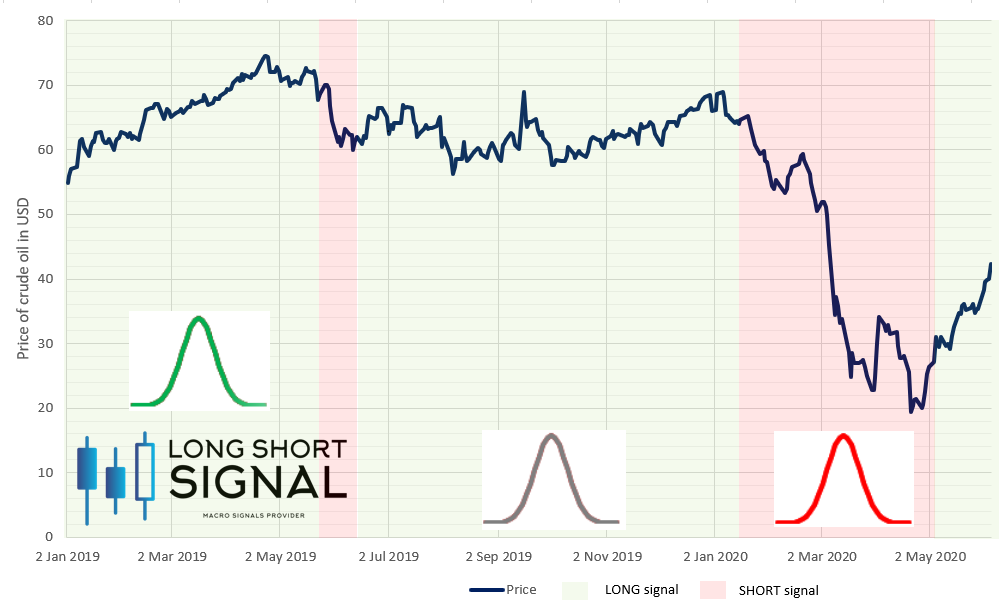
Image: Oil and the performance of the LongShortSignal.com model
Note: Our models are fine-tuned for the various asset classes we cover. In some cases, such as Bitcoin, changes in regimes are calibrated solely on the asset itself. In other cases (such as with oil or stocks), we also incorporate the behaviour of other assets. If generally, oil tends to underperform when stocks become more volatile and the dollar strengthens, such signals may give the model increased certainty to make a call to "get out or go short".
- Courtesy of LongShortSignal's Quant Team.