
Posted on 14th Jul 2020 by the LSS team
We don't particularly like the look of the stock market at the moment. Admittedly, some of that is based on intuition. Pharmaceutical penny stocks suddenly spiking 100%, Elon Musk now being the fifth richest man in the world with Tesla having a higher value than Bank of America and American Express OR Toyota, Disney and Coca-Cola combined, and generally the market feeling manipulated and rallying into ever greater concerns about the health of the economy. Or what about the fact that the top few names in all US stock markets have often contributed more than 100% of total return on year-to-date basis? None of that is normal.
Some of our signals have had us short the stock market, but not convincingly so. For instance the Nikkei has been calling for us to be short for a while, and we had a profitable stint of being short the Euro Stoxx for a bit before turning long again. But we have yet to see real change for the likes of the S&P500 where our models haven't seen enough to tell them something is about to change.
Speaking personally, I am neutral on stocks at the moment. I see a possibility for rising vols which won't help the market but I also see quite clearly that central banks are "backstopping" the market. So with being out of the stock market in my personal investments but maintaining my investments in cryptocurrencies where I still see massive potential for outperformance over the near, medium and longer term (our crypto model portfolio is up +238% YTD, by the way), I am perhaps most interested to know how crypto markets will be affected by rising volatility in stock markets. Our Bitcoin signals have been telling us to be short since 21st June, while altcoins like Cardano have rallied massively (up +62% since our recent signal to go LONG on 20th June).
The easiest way to monitor how these two assets co-behave is through studying asset class correlations. If you follow that link, you'll find one huge correlation matrix with as of today 756 pairwise correlations in it. This will tell you that the correlation between Bitcoin and the S&P500 over the last 3 months stands at 0.11. Meanwhile if we look at the same number towards the end of June 2020, it read 0.26. So correlations have been high but they have also been falling. You can check back regularly to see how it develops, but perhaps below chart provides an even clearer picture.
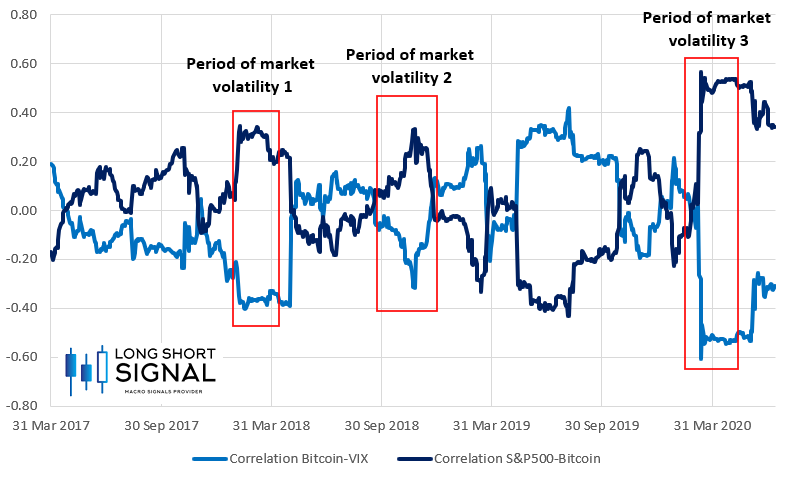
The chart shows correlation between stocks and Bitcoin (dark blue line) and correlation between stock volatility and Bitcoin (light blue line). I have highlighted three periods in which the S&P500 sold off significantly (the "COVID sell-off" in 2020, as well as the the Q1 and Q4 2018 volatility and drawdown). A few things stand out to me. First, correlation between stocks and Bitcoin in this sell-off reached higher levels than ever before in the last few years, and this is perhaps the trend we should expect to continue.
Second, looking at Bitcoin and stocks during periods of lower volatility and drawing conclusions from it is dangerous. Remember the attack on the Iranian general in January? That's the period right before where the second red box starts and the correlation between stocks and Bitcoin turned decidedly negative. Not only that, but the correlation between VIX and Bitcoin turned positive, classic safe haven behavior! But I think what we should take away from this is that whenever it really matters, Bitcoin sells off with stocks. This is clearly what each of these periods are telling us. And with that, today may be a good time to be cautious on crypto markets.