Posted on 5th Jul 2020 by the LSS team
Our premium and crypto subscribers get access to the full range of LSS (crypto) signals, which they can use to their own benefit in their own investment processes. In addition to simply receiving the signals, subscribers get access to our flagship model portfolios for both traditional/crypto and pure crypto assets. This is the product where all of our best ideas come together and we wanted to highlight some of the recent risk/return characteristics and the benefits of following along with our trading signals here.
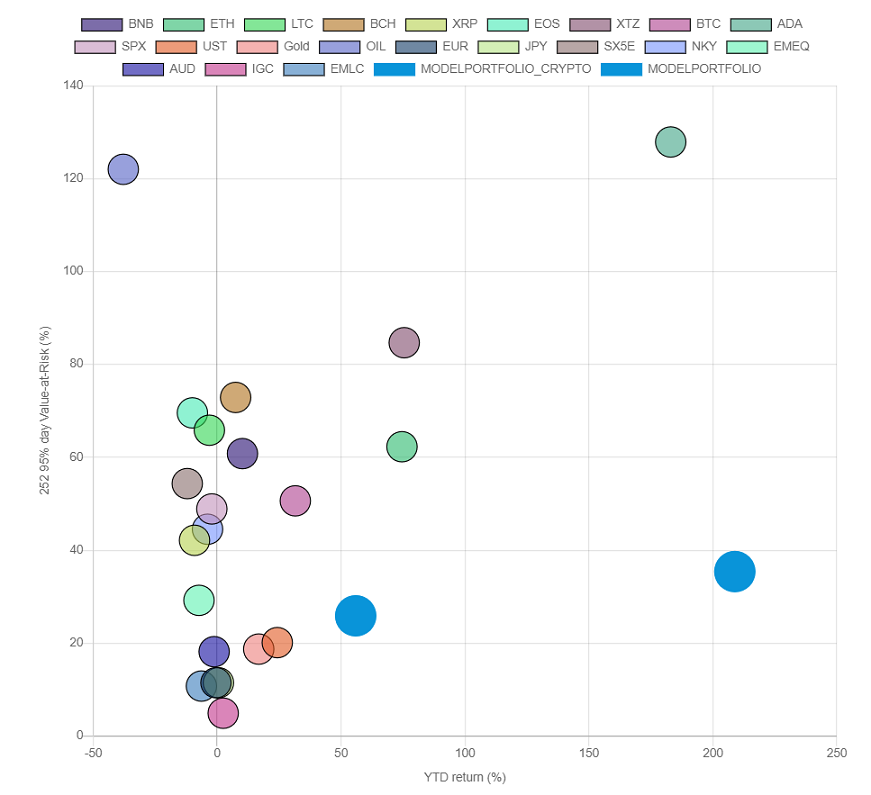
Let us simply start off by showing you how the model portfolios have fared in 2020, compared to a wide range of other assets. The large blue circles represent our model portfolios and they are shown in terms of year-to-date return (on the horizontal access, the further to the right the higher the return) and their 95% Value at Risk level (on the vertical axis, the higher up the higher the risk level). Note: 95% 252 day Value at Risk can be interpreted as the maximum amount an asset or portfolio would be expected to lose with 95% certainty over a 1 year horizon.
For our model portfolio this is about 26%, compared to 49% on the S&P500. Meanwhile the model portfolio has returned +56% compared to -2% on the S&P500. Of course 2020 has been an unusually volatile year, which creates opportunities for quantitiative investing strategies that can catch the changing tides, and so returns of this magnitude should not be expected every year. Still, if we could generate about half of this every year and you followed our calls, an initial investment of $10,000 could grow to no less than $34,000 in 5 years time.

It is quite obvious to see that our models have delivered returns much further out on the return spectrum, while being much lower in risk. So how do we achieve this? It is really the combination of a few of the core concepts that drive our investment approach. In short summary, we believe that combining a range of models that can go long and short while dynamically adjusting allocations based on their win rates and market momentum helps us to outperform. OK, slow down a little, can we repeat that?
Catching market momentum: Even for financial market practitioners, catching on to changing momentum in different asset classes can be a challenge. It requires deep understanding of markets, perhaps economics and current world events. Now imagine that for a dozen or more asset classes you have a model tapped in to the market every day to provide you with signals of such changing dynamics. If you can catch the majority of the shifts in time, you can expect to generate strong outperformance.
A wide range of models: Not every model will do great. We measure the "performance" of our models based on their win rates: the percentage of calls that they got directionally right. Note that this statistic can still be slightly skewed and a model with a 50% win rate can still be hugely succesful if on average the losses are -2% while the gains are +10%. We believe that by combining a wide range of models (8 assets in total in our model portfolio as we speak), we can achieve diversification. In our situation, diversification is less about reducing market risk but more about reducing model risk.
Adjusting model exposure based on win rates: If a model starts to outperform and gets most of its calls right, we will expand our allocation to it. If a model makes a few wrong calls in a row, we will automatically reduce exposure to it until it gets things in order again (something which may require human intervention).
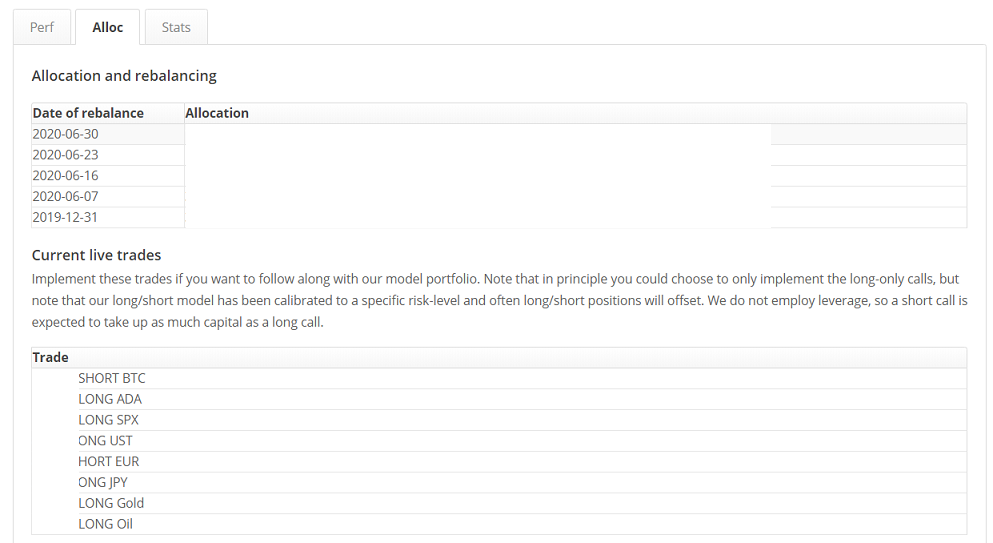
LongShortSignal is a minimalistic platform and we present our signals to subscribers in a similarly simple way. On the performance pages of our model and crypto model portfolio, subscribers get to see our most recent allocation and live trades. These are subject to change on a weekly and daily basis.
